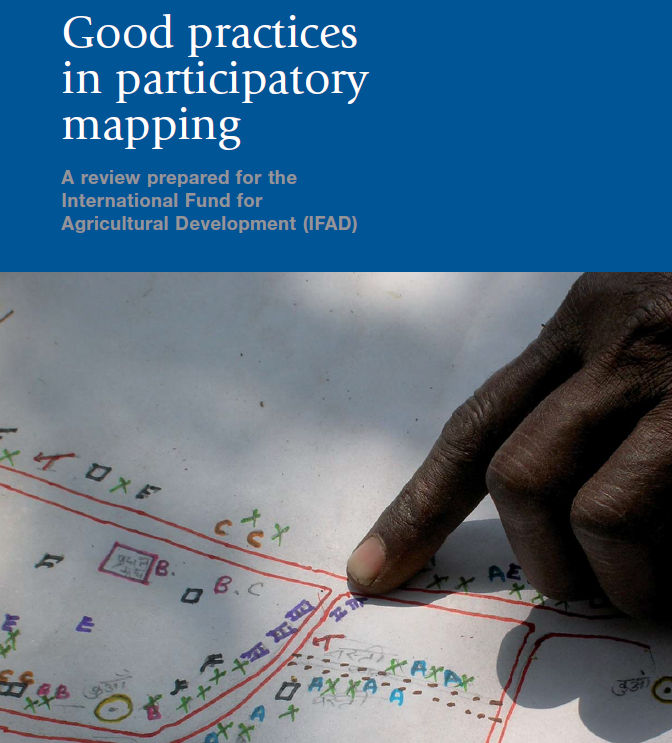
This third part in the series on participatory methods talks about community mapping as a way to visualise results of discussions, of transect walks or of auto-photography. Check out my new project called ‘#mapyourhood’, inviting you to try out this technique together with friends and family. It is guaranteed to give you a different perspective of your own neighbourhood!
Maps are a great instrument to understand many different aspects of a neighbourhood or even just a street. If you are undertaking a participatory process with community members, it is important to visualise all the ideas and results of your discussions in a concise and creative manner. This is where maps come in, because they can show so many issues at one glance and also include the geographical information that is important.
How to create and change maps
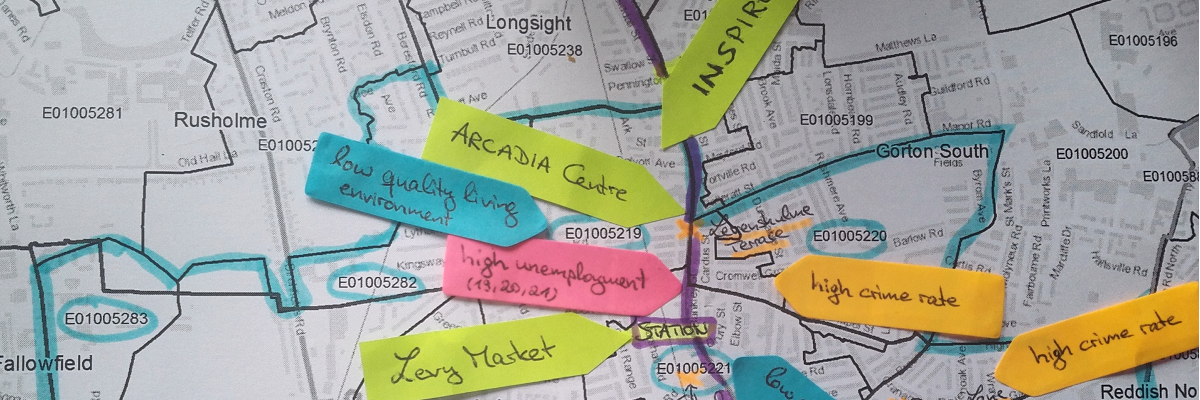
Maps are usually available online and offline, in GPS systems or from suppliers such as Open Street Map. However, these maps only show grids and basic information to navigate; they do not represent neighbourhoods and they often do not even include information on the way they were sourced. For example, who decides where the boundaries of a neighbourhood are and how to put them on a map? In a neighbourhood planning project I did in the UK, we talked about Manchester’s neighbourhood Levenshulme and realised how differently neighbourhood boundaries can be perceived:
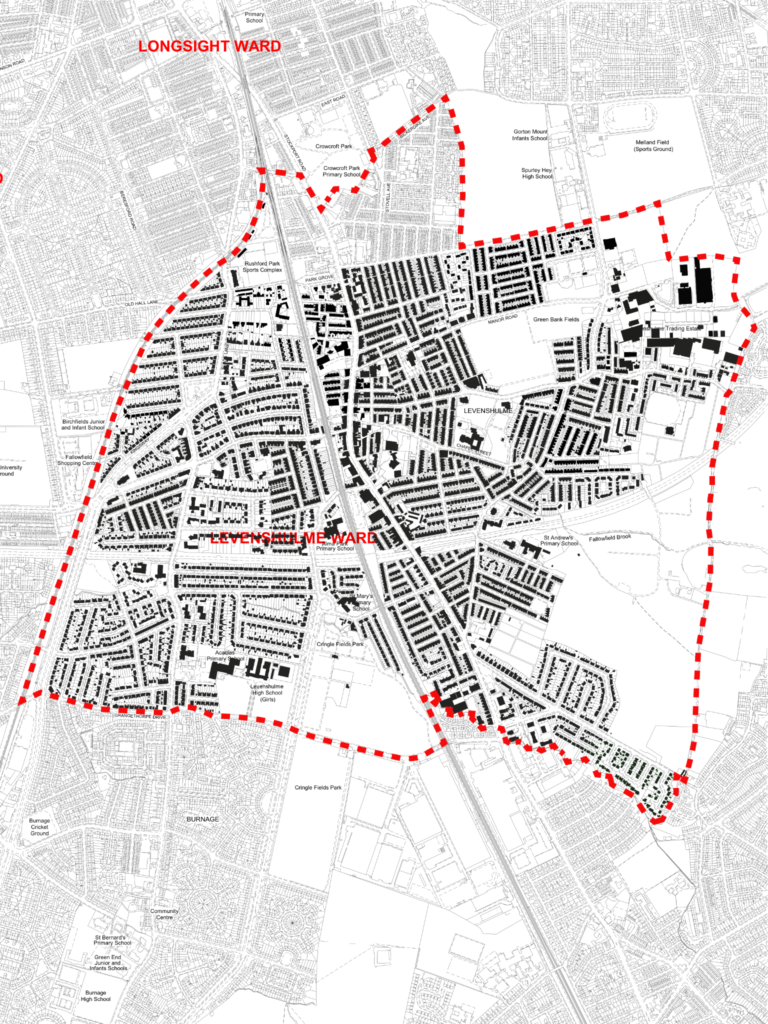
However, neighbours who have lived there all their lives and who have witnessed several changes in the boundaries tend to perceive the shape of the neighbourhood more like this:
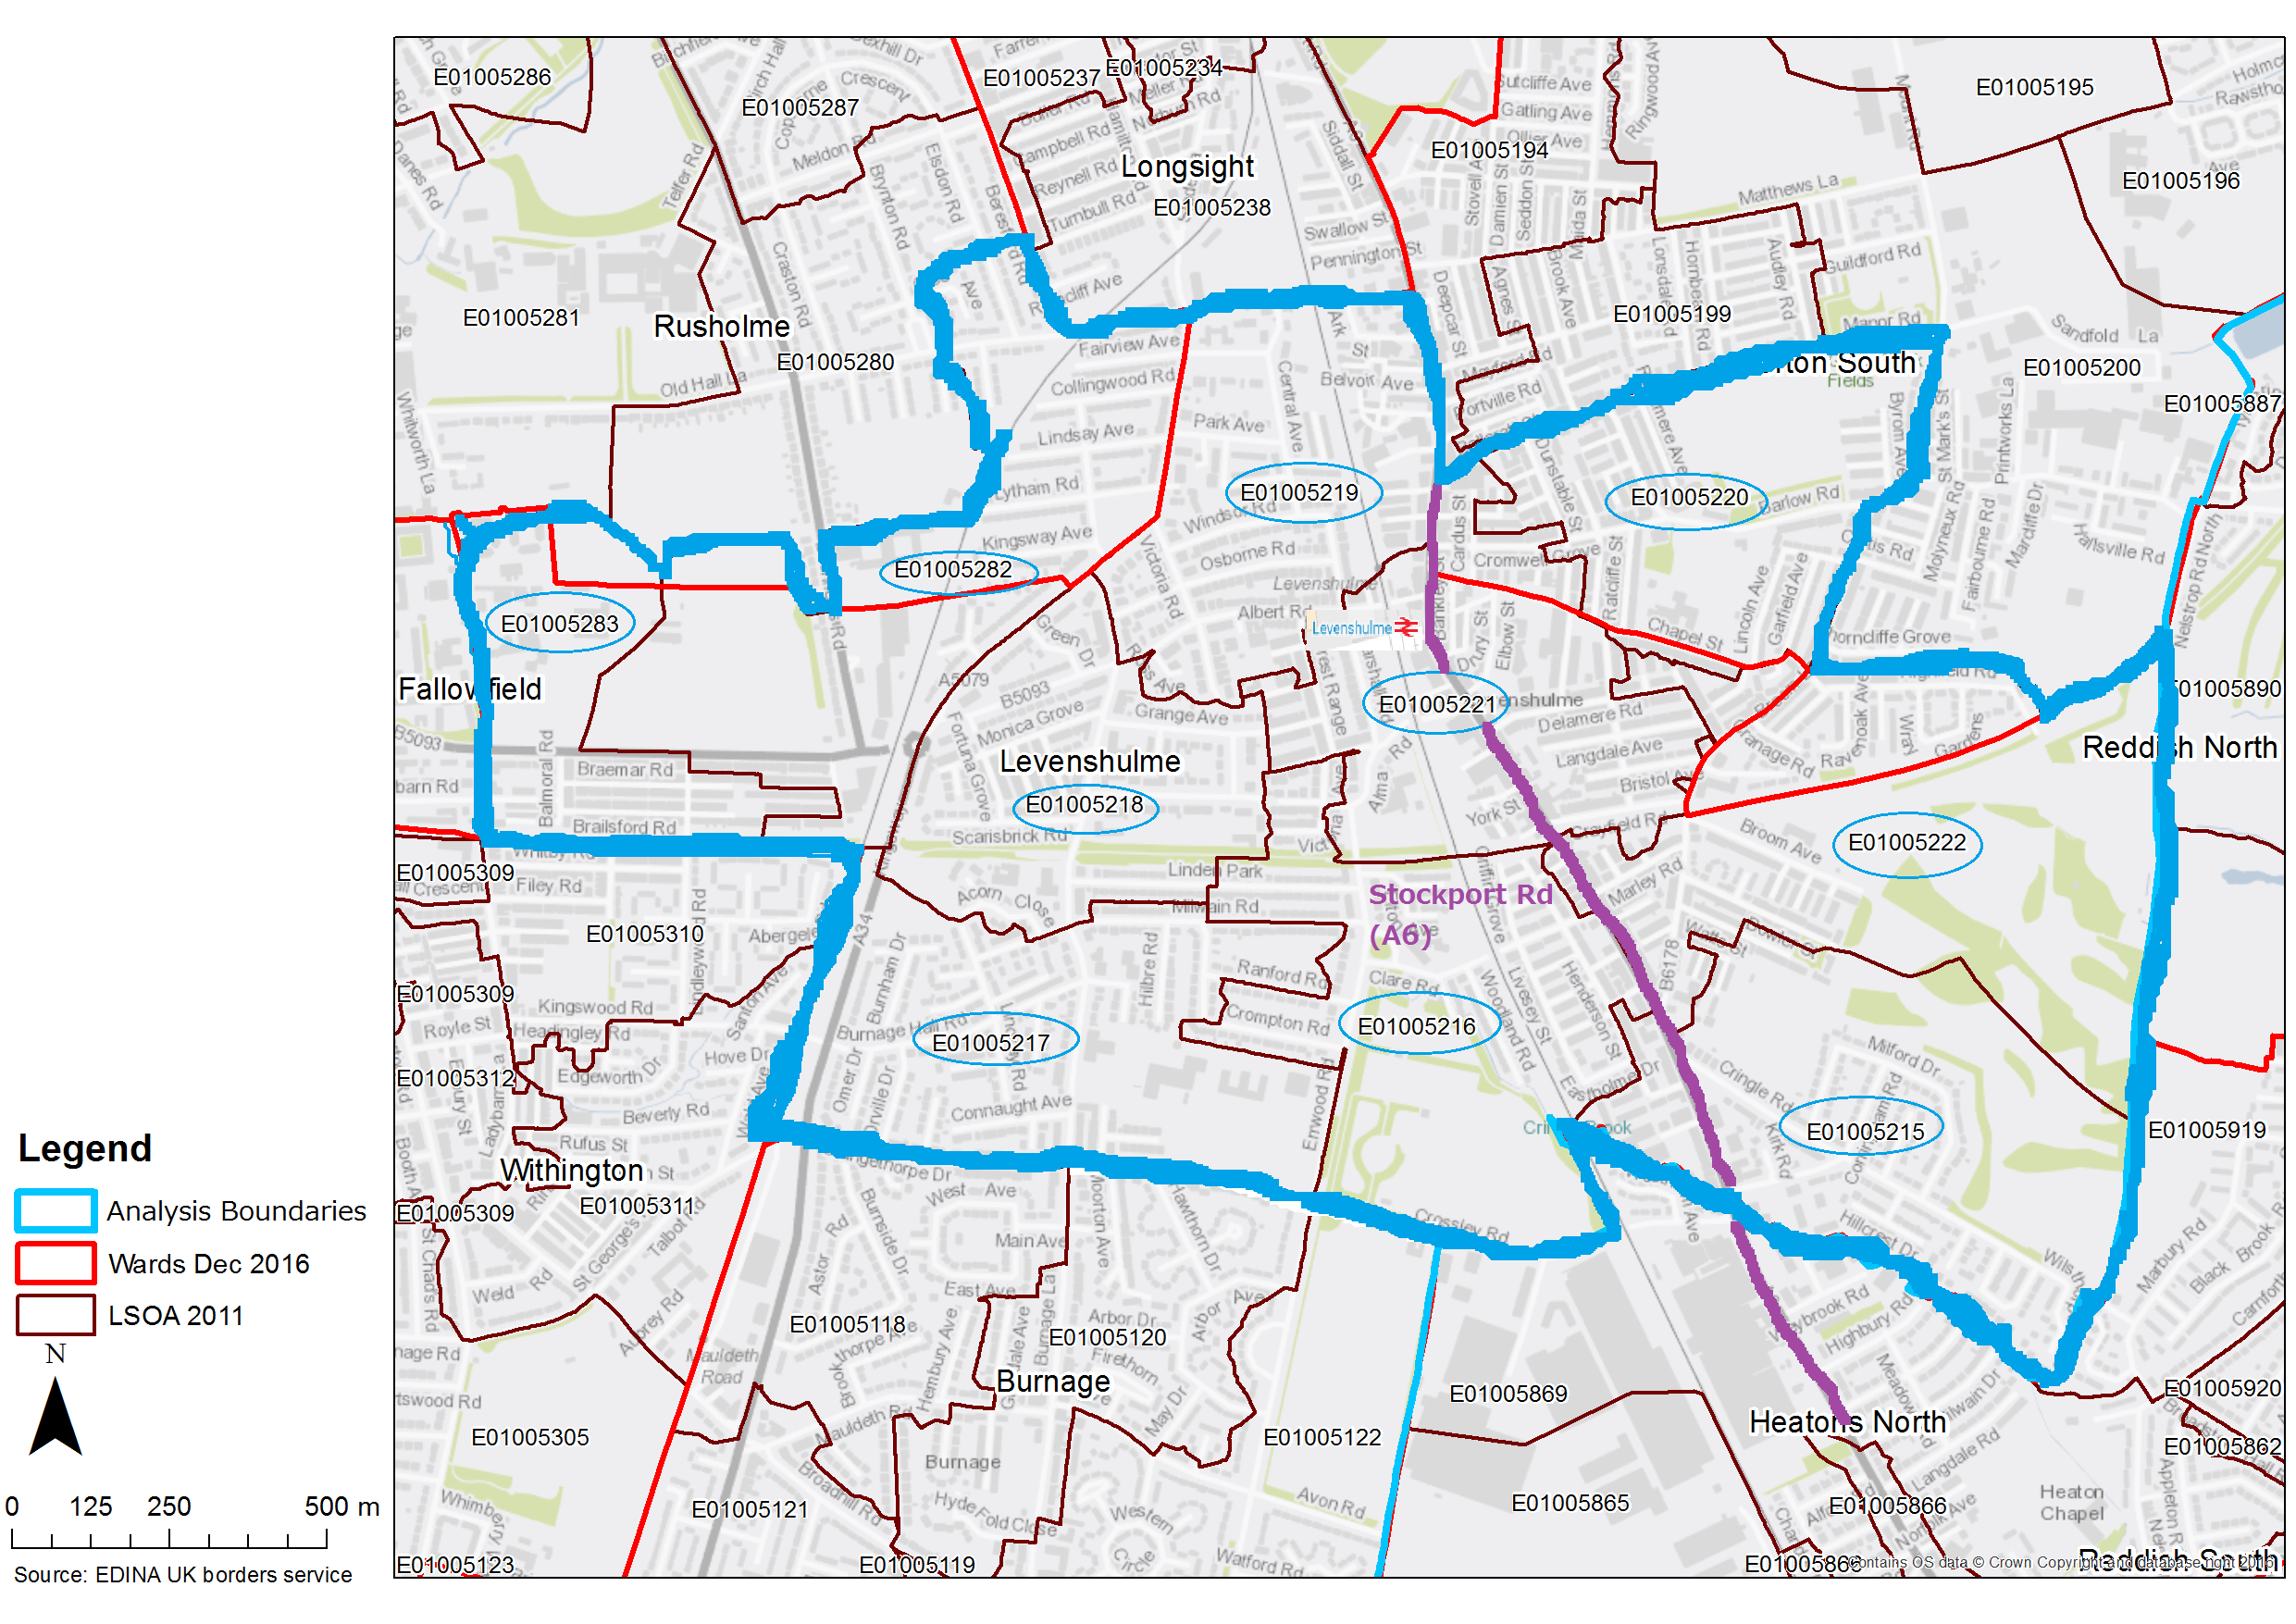
Deciding on boundaries, be they official or ‘perceived’, will help immensely with any participatory mapping project. At the same time, your work could actually result in changing the official boundaries if you can convince the municipality. NextCity has a great article on this, explaining the importance of neighbourhood definitions:
Why does this matter? Neighborhoods are the smallest organizing element in any city. A strong city is made up of strong neighborhoods, where the residents can effectively advocate for their needs. A neighborhood boundary marks off a particular geography and calls out important elements within that geography: architecture, street fabric, public spaces and natural resources, to name a few. Putting that line on a page lets residents begin to identify needs and set priorities. Without boundaries, there’s no way to know where to start.
A transect walk with carefully community members can help to identify the boundaries of the neighbourhood and then put it on the map. Using GoogleMaps, Open Street Maps or similar providers, you should print out the technical view of the area and then get creative. Using stickers, colours, word clouds and many other tools, map out the problems and potentials together with the neighbours.
Here is a quick overview of the benefits and shortcomings of this method:
Benefits
- Clearly showing any information that is relevant to the community
- Attractive and accessible visualisation
- Showing local knowledge and culture
- Pin-pointing crucial aspects
- Important part of an urban planning strategy
- Free, creative use of any media
Shortcomings
- Might be easier to apply in a rural context with tight-knit communities and people who have more time on their hands
- Not accessible to illiterate (or map-illiterate) people
- Potential conflicts can prevent agreement upon boundaries
Of course, every map will look very different and will be very subjective as well. However, in the spirit of participatory methods, it is crucial to ask the experts about their own neighbourhood – the people who live there! Their maps will not be perfect and probably not very accurate either, but they will reflect urgent issues and the gist of the neighbourhood much more than any conventional map. Use other participatory methods in combination with mapping and try out innovative ways of creating a map as unique as its neighbourhood!
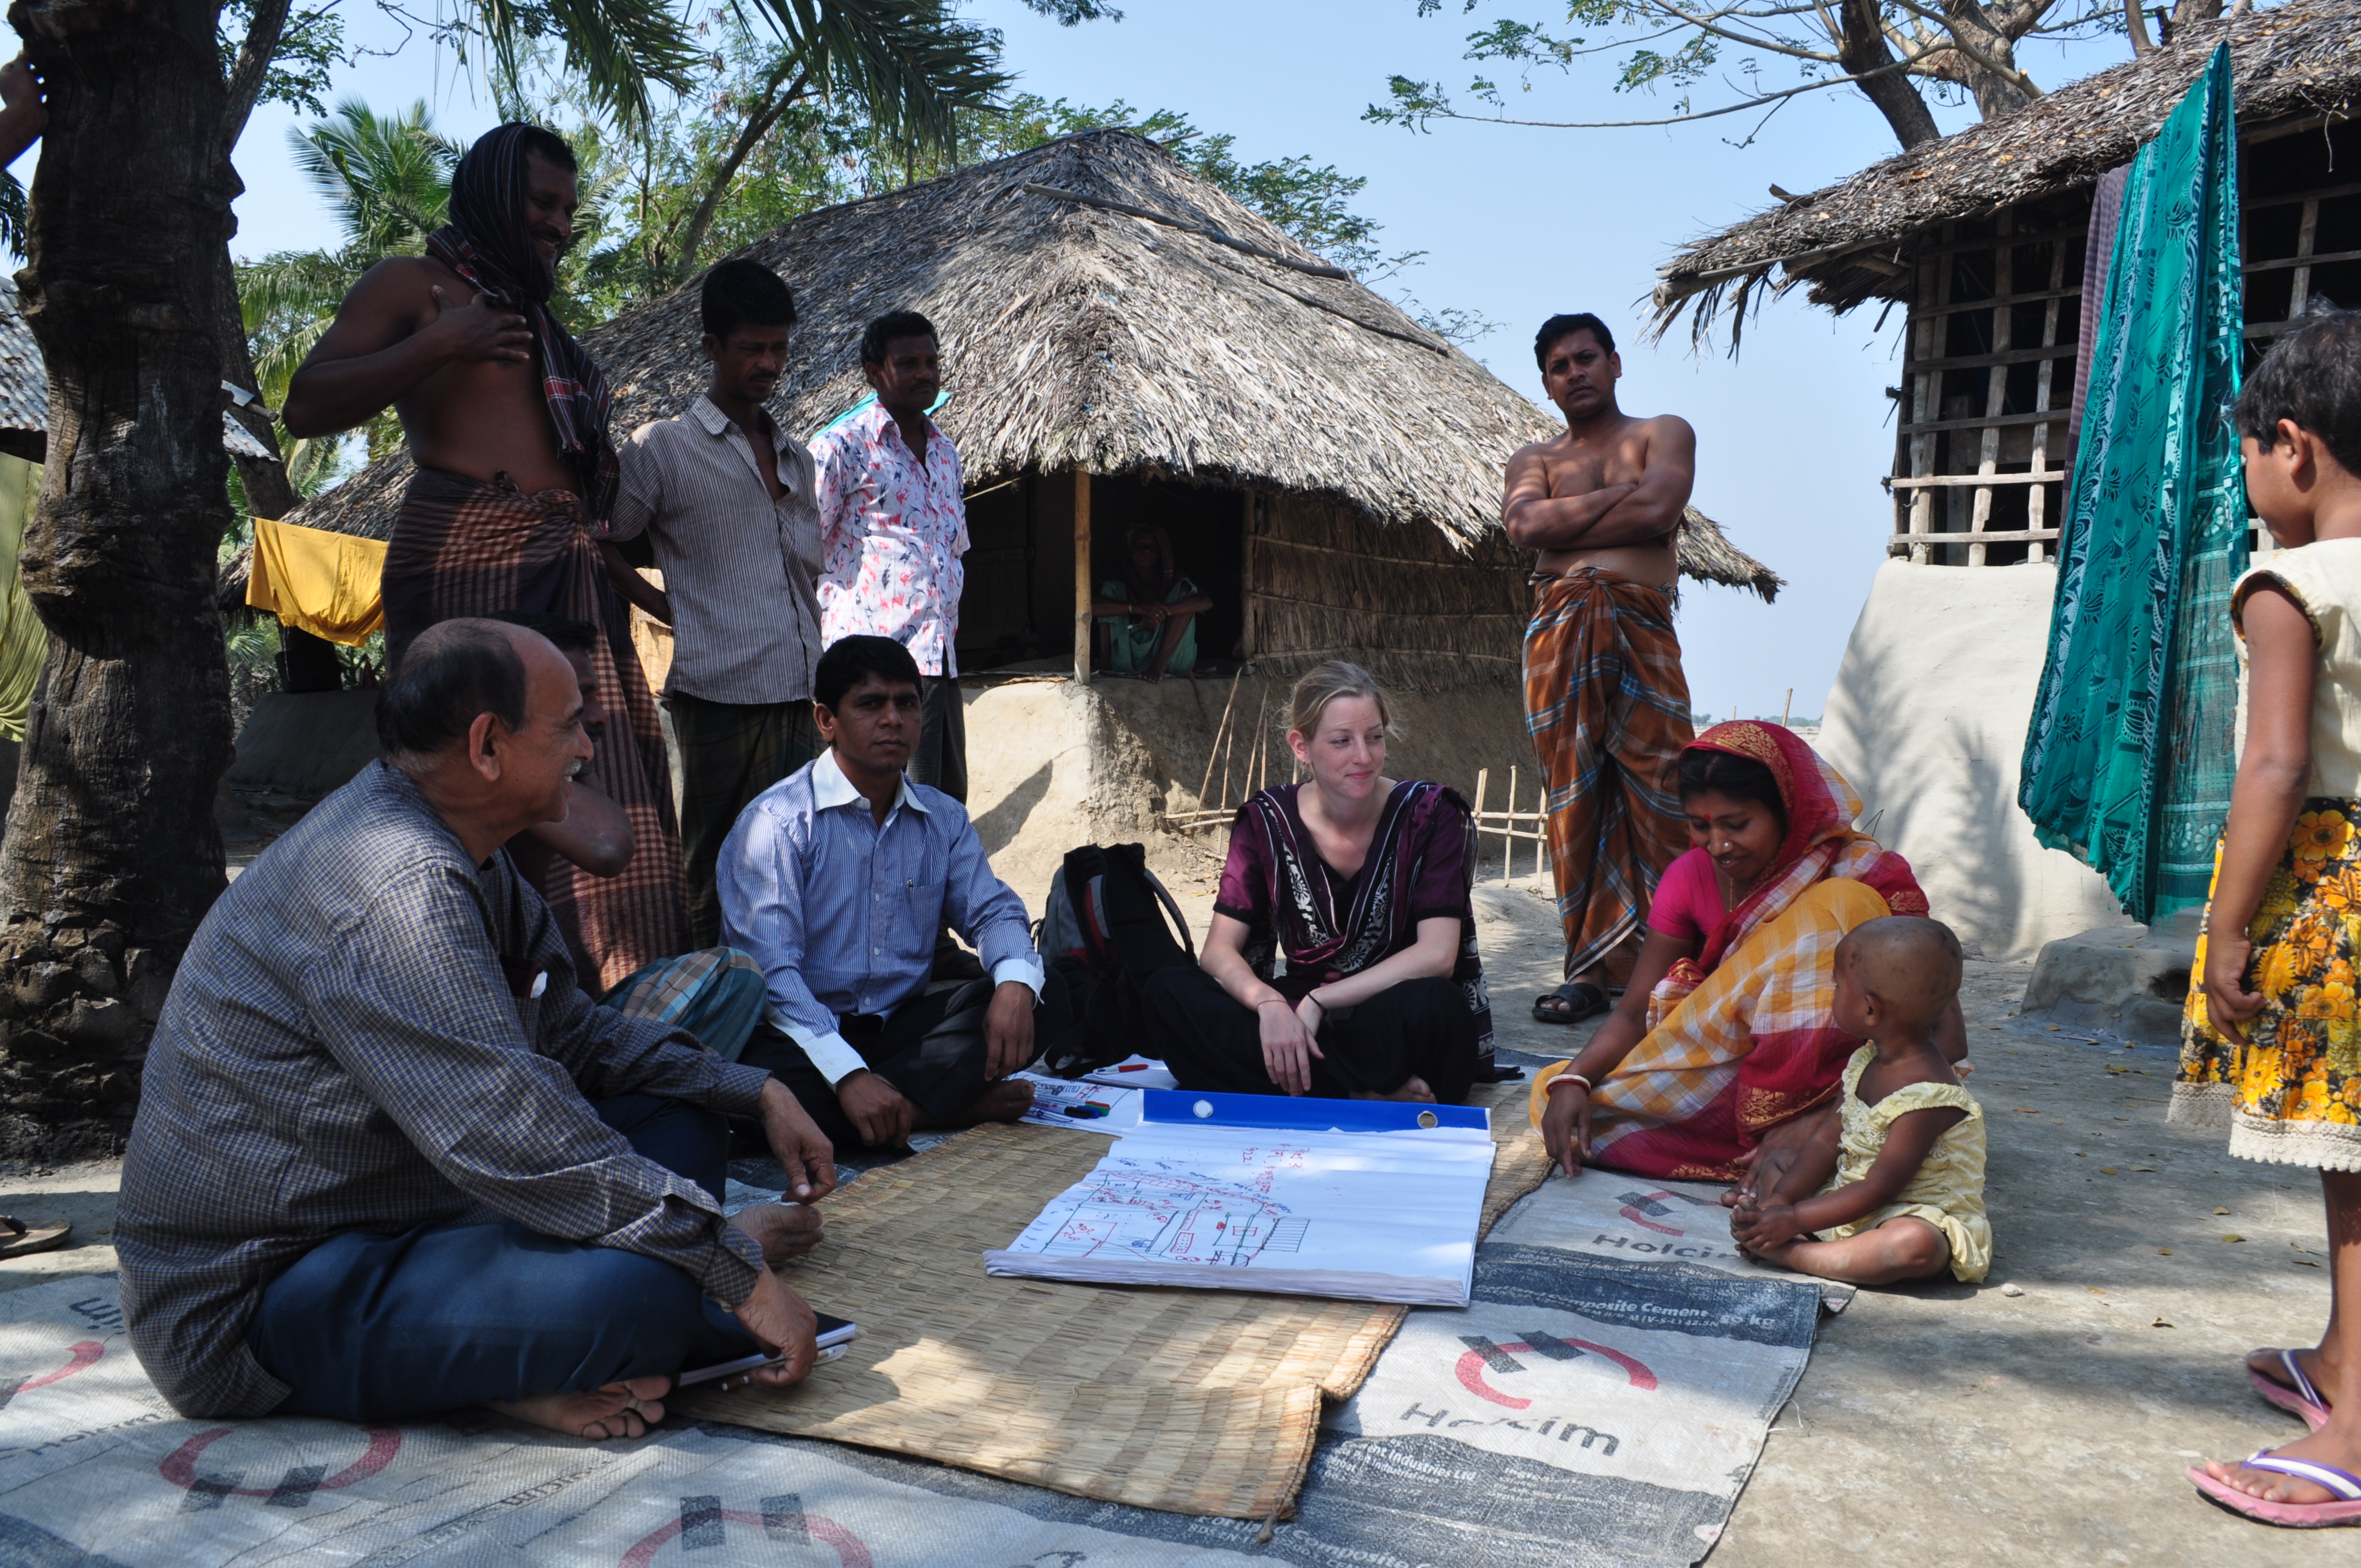
For a visual story of how a mapping process was implemented in Jhenaidah, Bangladesh, read this article (slideshow at the bottom):
Voices from Jhenaidah, Bangladesh
The header image is my own work, visualising some problems in Levenshulme, Manchester, UK. Also check out the website of Mapping for Rights for further ideas.
Did you know that I also work as a consultant on participatory methods? Get in touch to collaborate with me: laura@parcitypatory.org.